
Updates to the Support Chapter
Introduction
The “Support” chapter of Counting on Culture includes benchmarks for cultural sector funding in Ottawa from all three levels of government: municipal, provincial, and federal.
For the measures of federal funding, including Canada Council for the Arts (CCA) funding, Ottawa is compared to other major Canadian cities. The Canada Council measures are particularly important because CCA funding is often highly competitive and decided by a jury. These measures show the extent to which Ottawa’s artists and arts organizations can compete and win funding in competitions with their peers from other major urban centres.
The Counting on Culture Canada Council measures were based on data from the 2015-16 and 2016-17 federal fiscal years. (note 1) This report provides updates for the 2017-18, 2018-19, and 2019-20 fiscal years. It also provides additional context by showing the measures at the Census Metropolitan Area level and by including the number of applications.
This is not the full funding picture. Future reports will include updates to other funding measures from Counting on Culture, plus additional measures to be developed.
Update: 2017-18, 2018-19, 2019-20
Parliamentary appropriations for Canada Council are being doubled over a period of five years. This began in 2016-17. These additional funds could create opportunities for new applicants from historically under-funded areas to receive funding, but thus far it has not resulted in a significant shift in funding between Canada’s major cities.
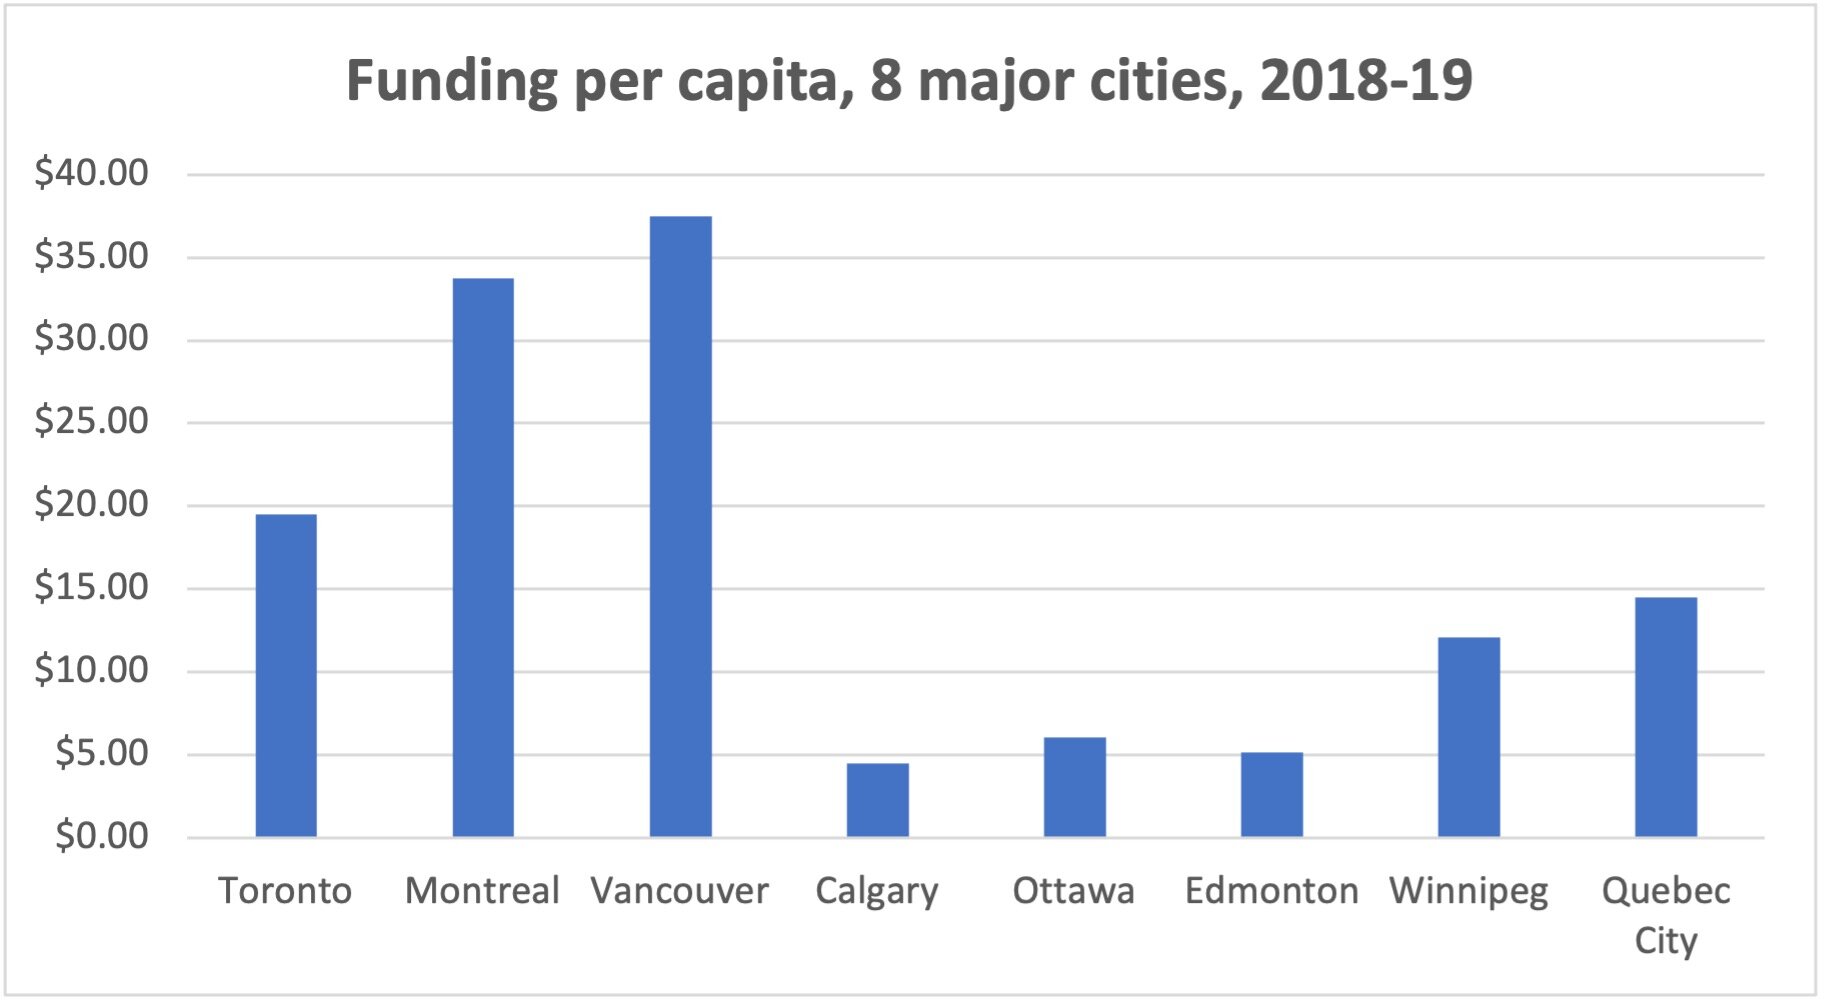
Counting on Culture showed that Ottawa’s artists and arts organizations received over 60% less per capita from Canada Council than their counterparts in Toronto, Montreal, Vancouver, Calgary, Edmonton, Winnipeg, and Quebec City. This was true in both 2015-16 and 2016-17. As the graphs on the following page show, this situation continued in 2017-18, 2018-19, and 2019-20.
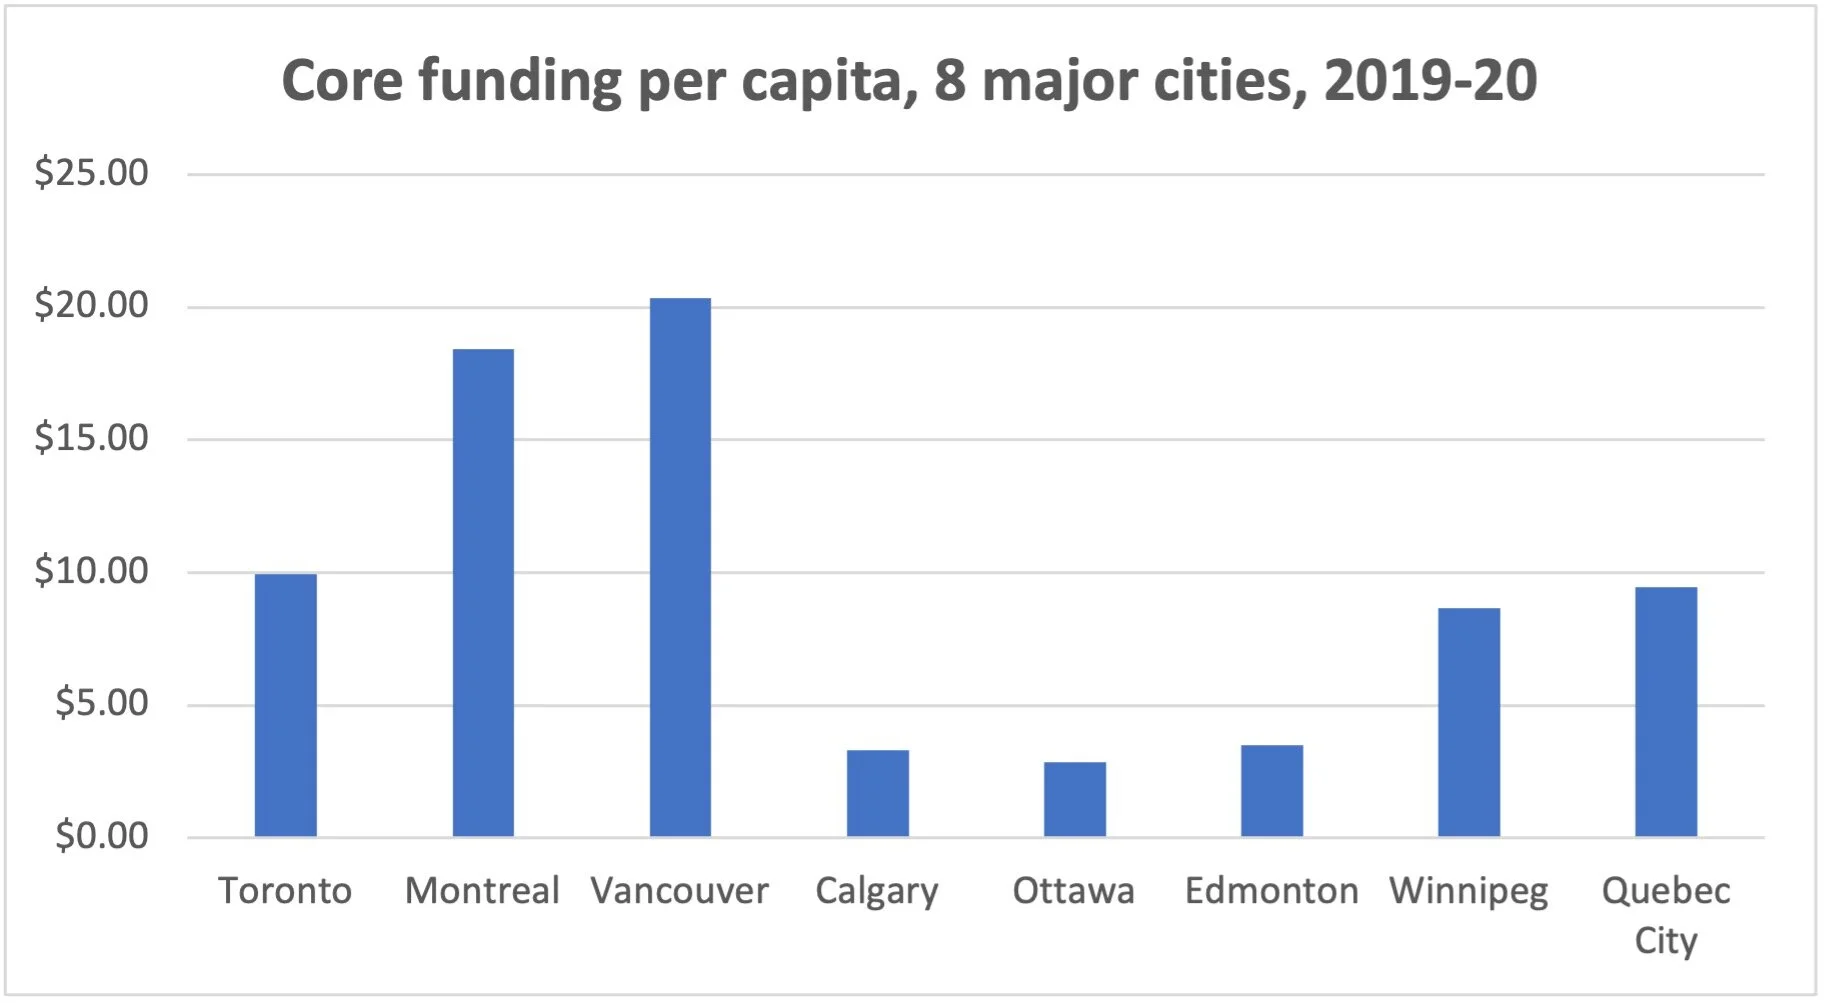
The funding gap between Ottawa and the other major Canadian cities is even more pronounced with Core Funding. This is multiyear operating funding that provides greater stability than Project Funding. It is more difficult for organizations to qualify for and receive Core Funding, so it also serves as a good indicator of the strength and stability of the local arts sector. The per capita funding gap for Core Funding is more than 70% in each of the three fiscal years. (note 2)


Census Metropolitan Areas
Census Metropolitan Areas (CMA) are census geographies that combine municipalities that have a strong commuting relationship. For example, Ottawa and Gatineau are part of the same CMA because there are many people that live in Ottawa and work in Gatineau and vice versa. Similarly, Richmond, BC is part of the Vancouver CMA and Mississauga, ON is part of the Toronto CMA. Appendix 7 of Counting on Culture shows the municipal and CMA boundaries of the eight cities that we use in our comparisons. (note 3)
Counting on Culture includes measures of funding from all three levels of government. Usually, only artists and organizations within the boundaries of the City of Ottawa are eligible for municipal culture funding in Ottawa. For consistency we used the municipal boundaries for analyzing funding from provincial and federal governments, as well. However, the limitation with using municipal boundaries is that they are very inconsistent across the country. In some places, such as Ottawa, amalgamations have created municipalities that cover large urban, suburban, and even rural areas; whereas in other places, such as Vancouver, the municipal boundaries cover a much smaller area.
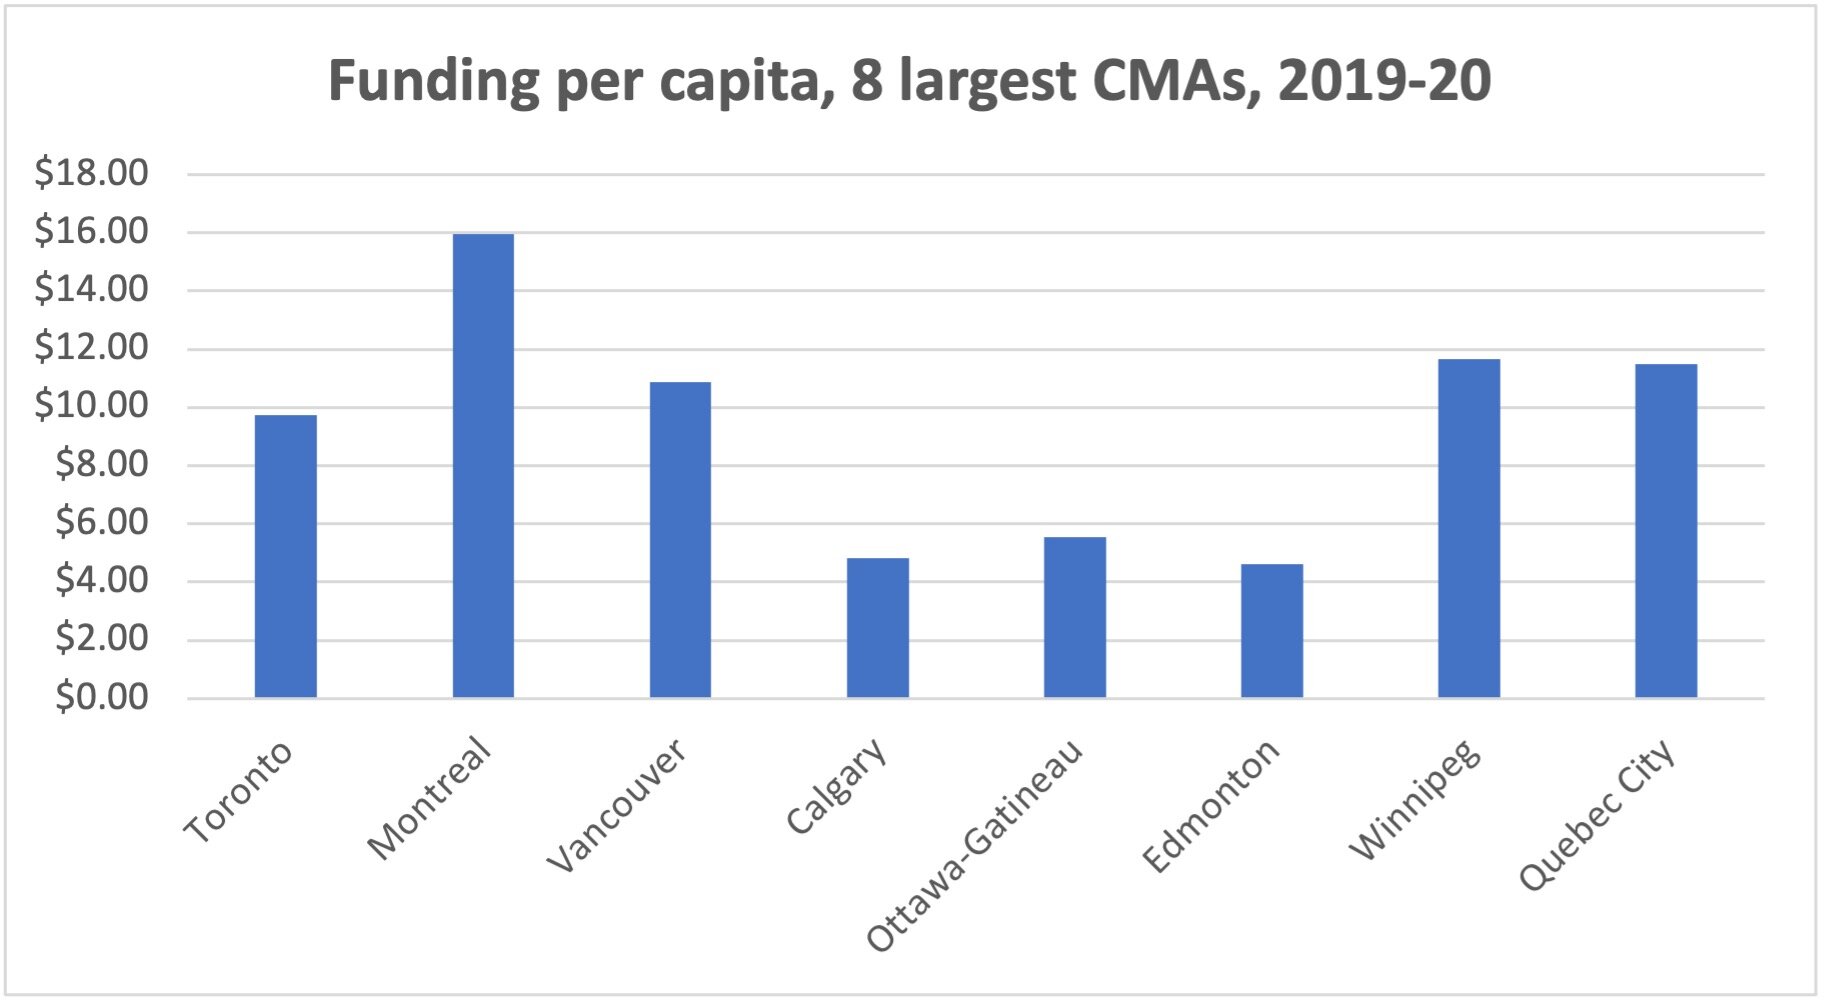
The CMAs surrounding some of Canada’s major cities include large suburban areas that have many residents but relatively few artists and arts organizations that receive Canada Council funding. This brings down the per capita funding numbers in all eight cities, but in some more than others.
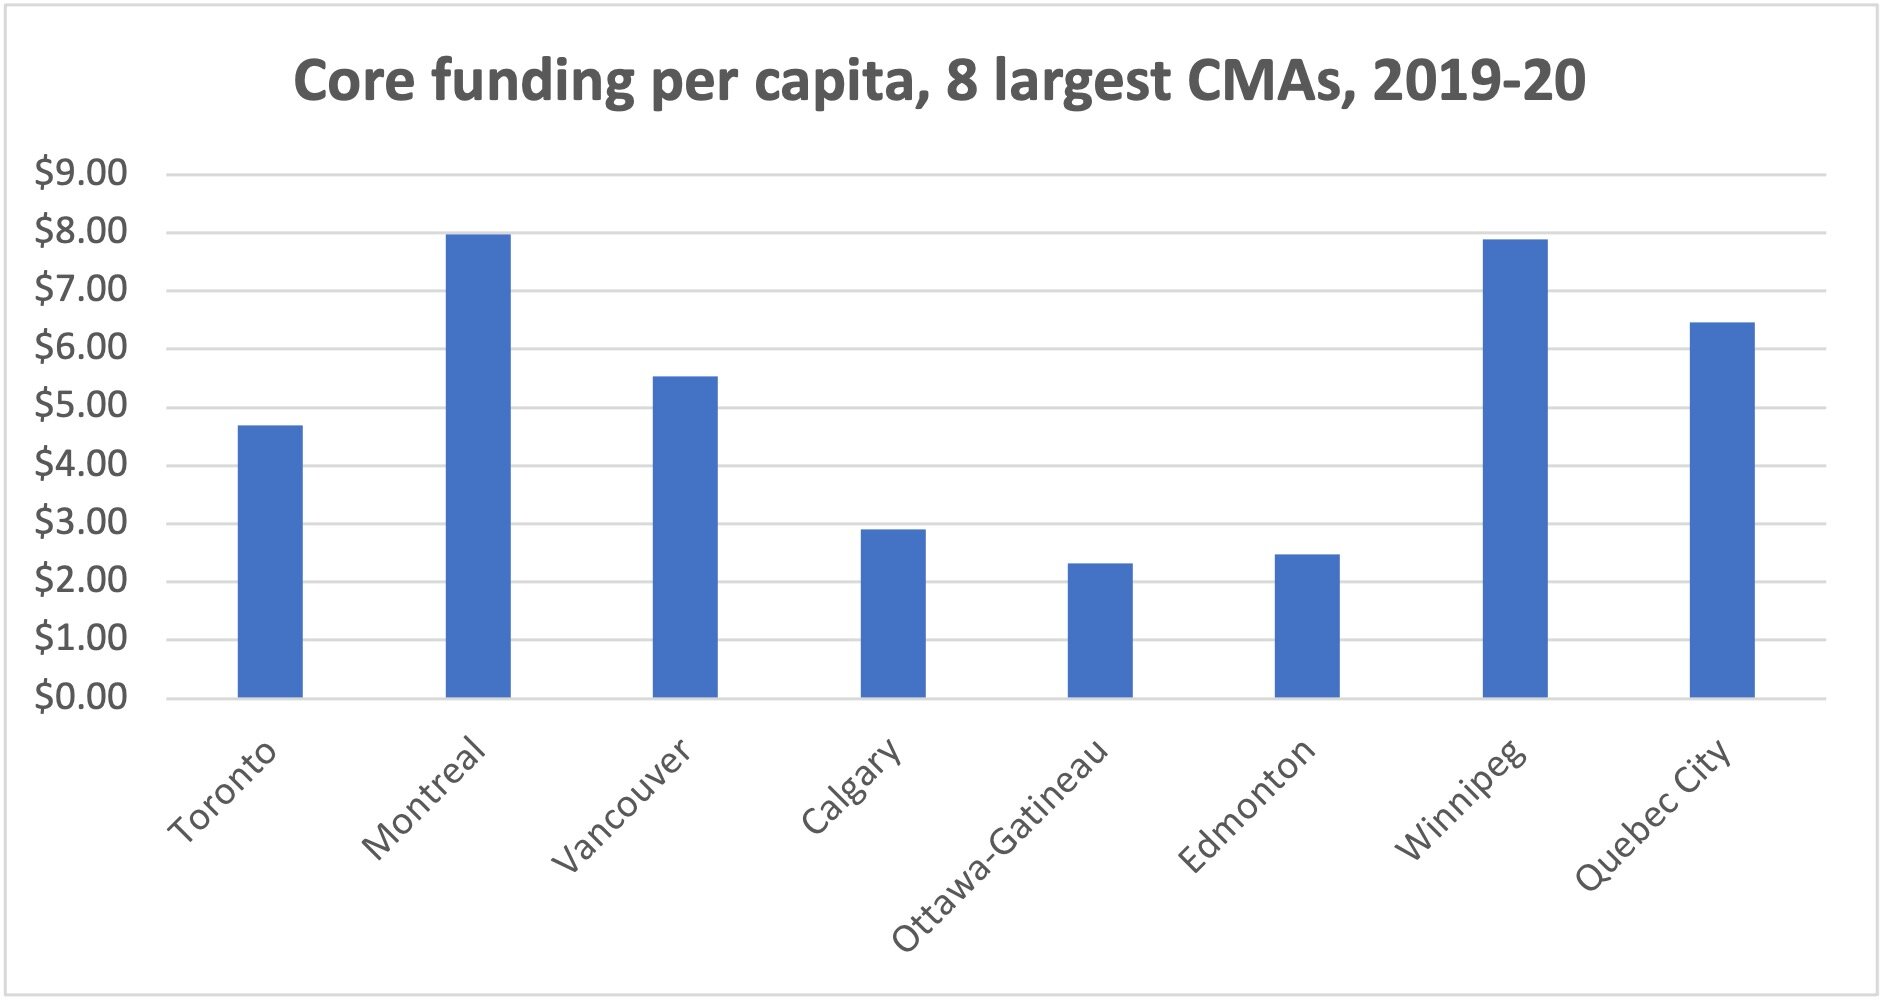
At the CMA level the funding gap between Ottawa-Gatineau and the other large CMAs is somewhat smaller than the gap at the city level, but Ottawa-Gatineau artists and arts organizations still receive just over half as much per capita as their counterparts in the other areas. Just like at the city level, the funding gap at the CMA level is also more pronounced for Core Funding. Canada Council per capita Core Funding to Ottawa-Gatineau artists and arts organizations was the lowest of the eight largest CMAs in each of the last three fiscal years. (note 4)


Success Rate
In Counting on Culture, it was stated that:
“Given that Canada Council awards funding on a comparative basis and does not have regional envelopes or targets, Canada Council recommends analyzing funding results against application levels. The Council expects to see application and funding shares that are relatively proportional.”
Therefore, CCA staff committed to working with the OCRG to provide data on the number of applications and applicants at a local level. This makes it possible to calculate a success rate for each community, and to see the extent to which the funding gap is caused by differences in the number of applications and amounts requested.
Receiving these data was a significant breakthrough. In the past, CCA staff have compared funding results against application levels at the provincial/territorial level, but only for internal analysis – they had never released this sort of information outside of their organization until now.
Ideally, we would have received the number of applications and applicants at both the city and CMA levels to be consistent with the rest of the analysis in this update. Unfortunately, Canada Council staff were not able to provide the data at the city level, so only CMA level analysis was possible. Canada Council provided data for the fiscal years 2007-08 to 2019-20, which includes the fiscal years analyzed in Counting on Culture and this update.
We have calculated the success rate in two different ways:
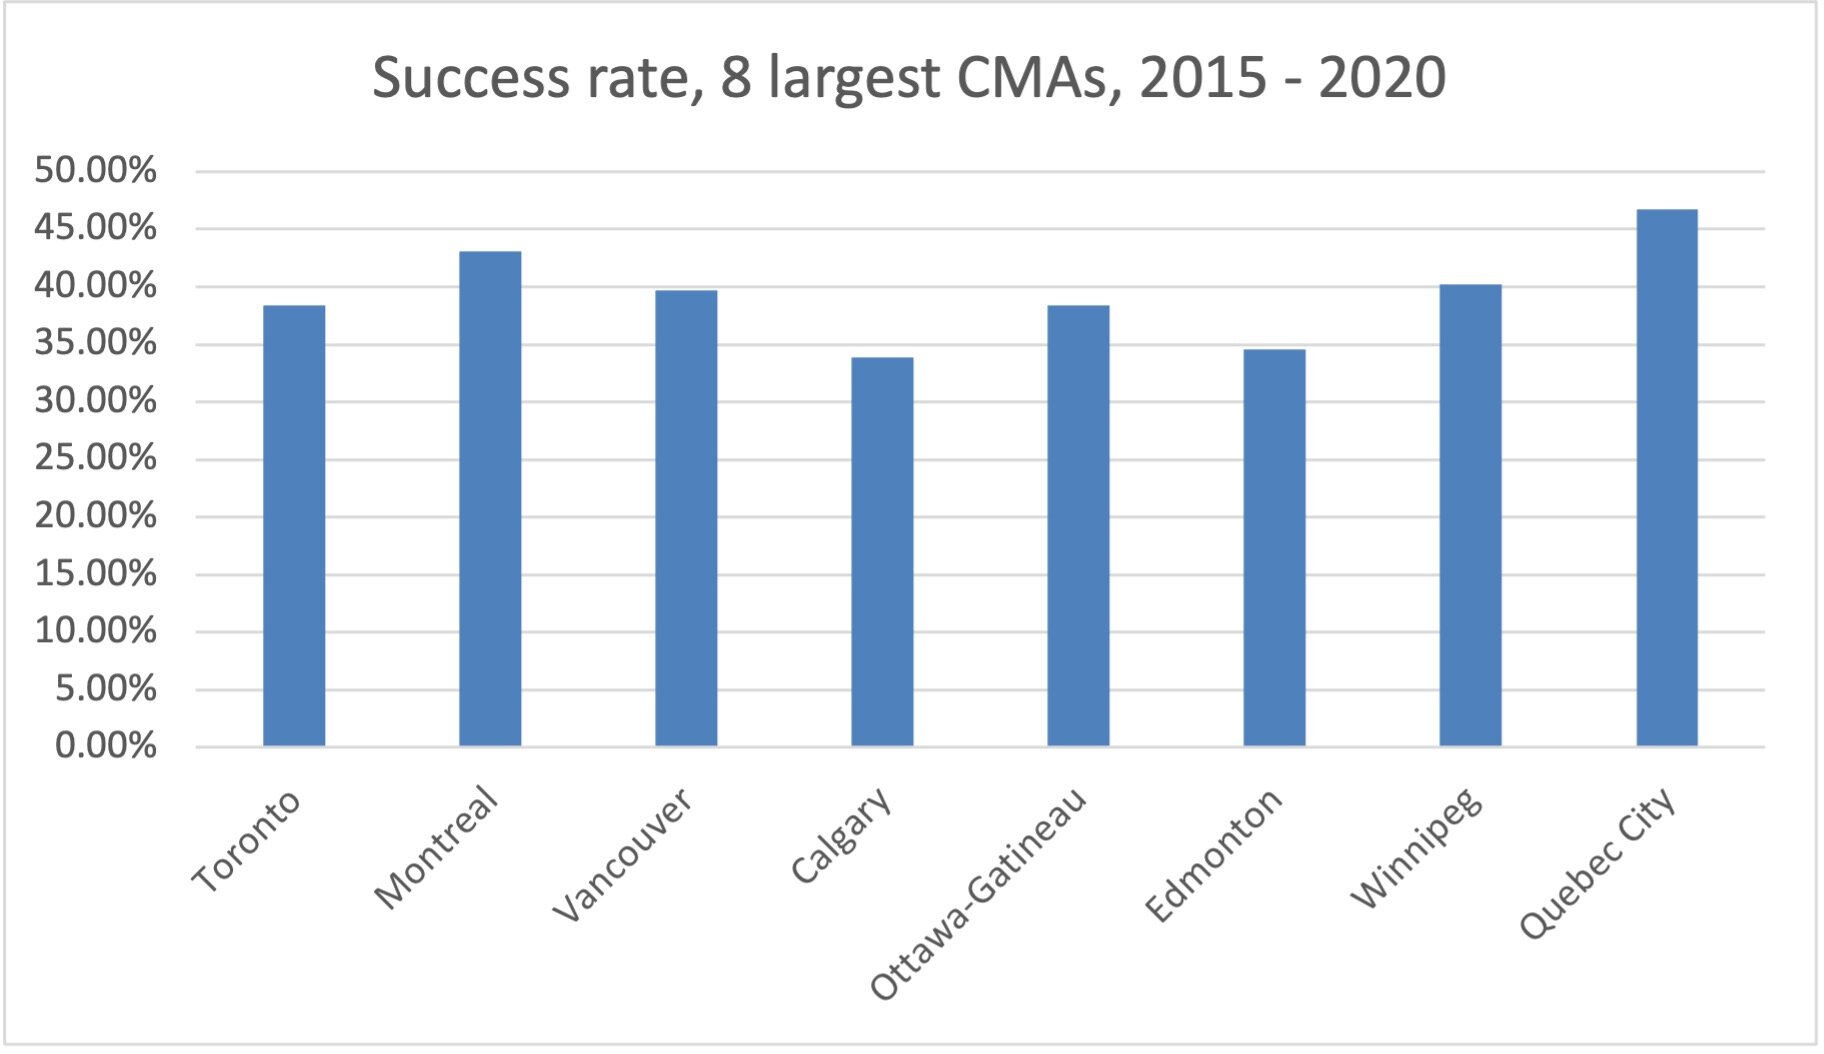
The percentage of applications in each CMA that were approved for funding (any amount); and
The total amount awarded in each CMA as a percentage of the total amount requested from all applications in that CMA. (note 5)
The data show that, in general, communities with more applications receive more funding. However, the success rate does vary somewhat between the CMAs, with Québec City’s success rate for the fiscal years 2015-16 to 2019-20 being the highest of the eight largest CMAs using both approaches outlined above. Ottawa-Gatineau’s success rate for those years (38.41%) ranked fifth among the large CMAs, as a percentage of applications. However, as a percentage of funds requested, Ottawa-Gatineau’s success rate (35.94%) was second lowest, only above Calgary. (note 6) (note 7)

Notes
The federal fiscal year is April 1 to March 31.
Canada Council for the Arts funding data were retrieved from their website: Data Tables | Canada Council for the Arts. Population estimates for cities are from Statistics Canada, Census Subdivisions, July 1 of the fiscal year.
For a more detailed explanation of Census Metropolitan Areas, see Statistics Canada.
Canada Council for the Arts funding data were retrieved from their website: Data Tables | Canada Council for the Arts. Population estimates for Census Metropolitan Areas are from Statistics Canada, July 1 of the fiscal year.
These amounts are being reported in their competition fiscal year (the fiscal year in which the applicant applied and competed for funding), whereas Canada Council’s publicly reported funding data is based on commitment fiscal year (the fiscal year in which the money is to be received by the successful applicant). The commitment fiscal year may be different from the competition fiscal year because of multiyear funding awards.
These figures include all applications submitted to Canada Council from the eight largest CMAs, including withdrawn applications and applications from ineligible applicants.
Canada Council for the Arts application/success rate data were received directly from CCA staff. Canada Council was one of the original members of the Ottawa Culture Research Group when the OCRG formed in 2016. However, due to workload challenges they are no longer part of the Group, though they continue to provide data. As such, the opinions and interpretations in this report are those of the authors (current OCRG members) and do not necessarily reflect those of the Canada Council for the Arts.