
Cultural Workforce Participation and Income by Sex
Participation
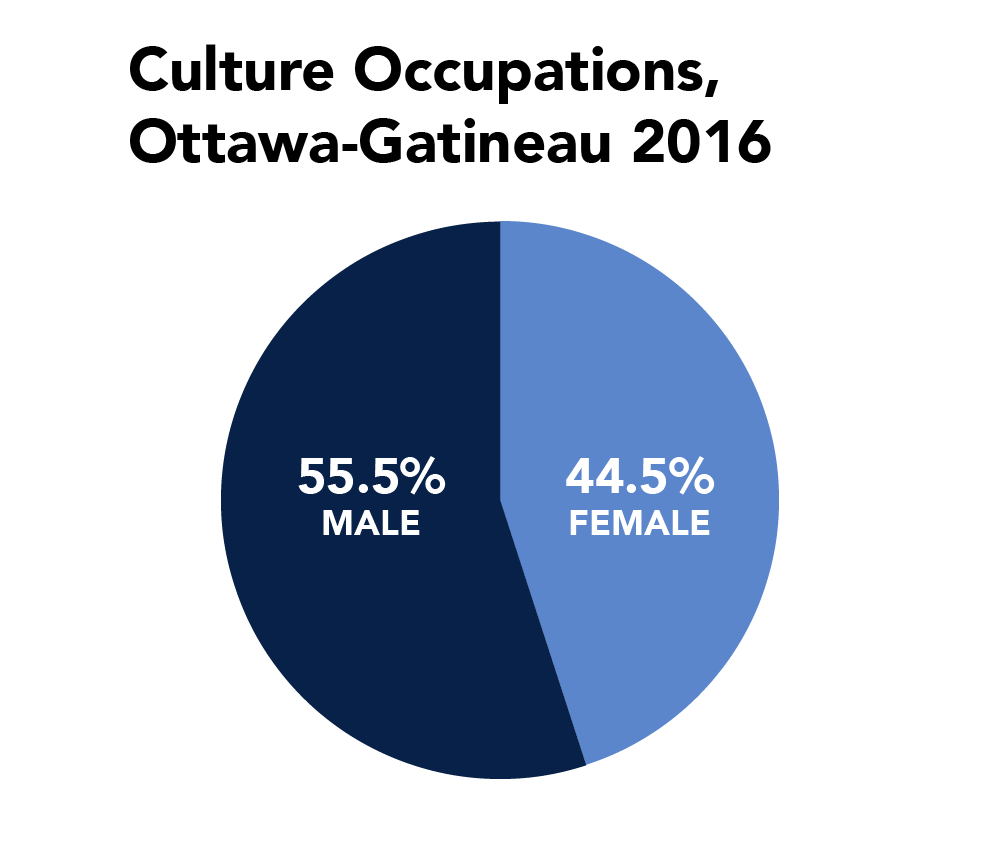
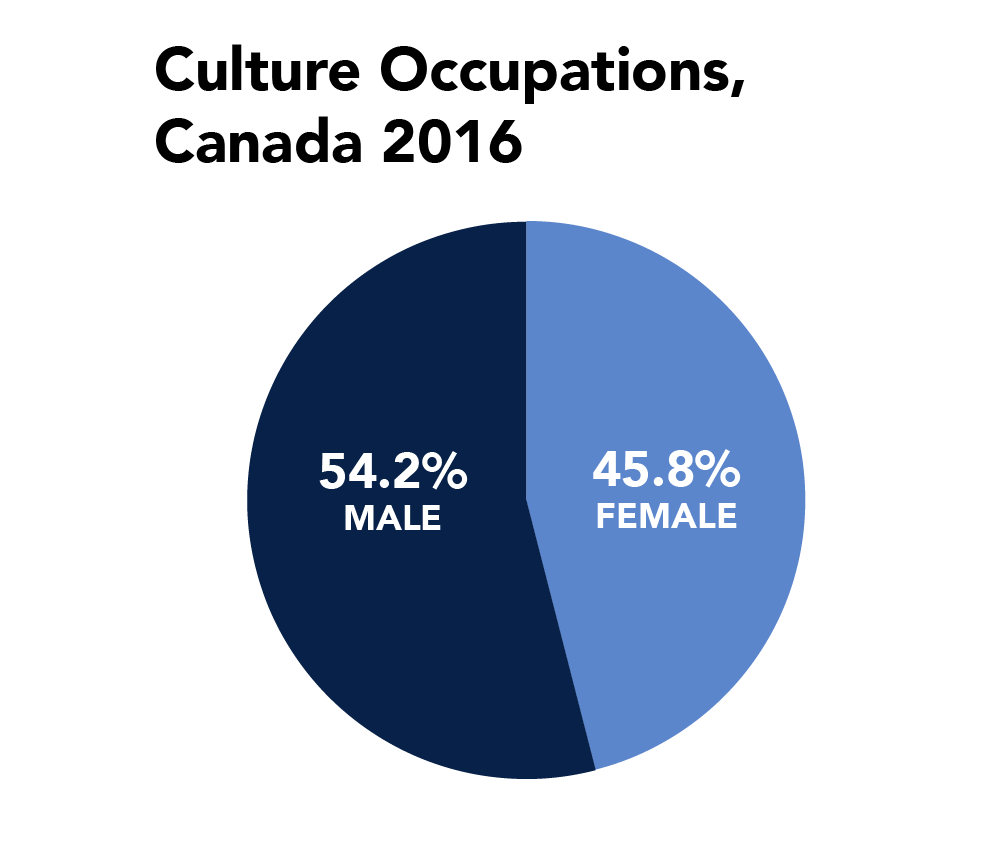
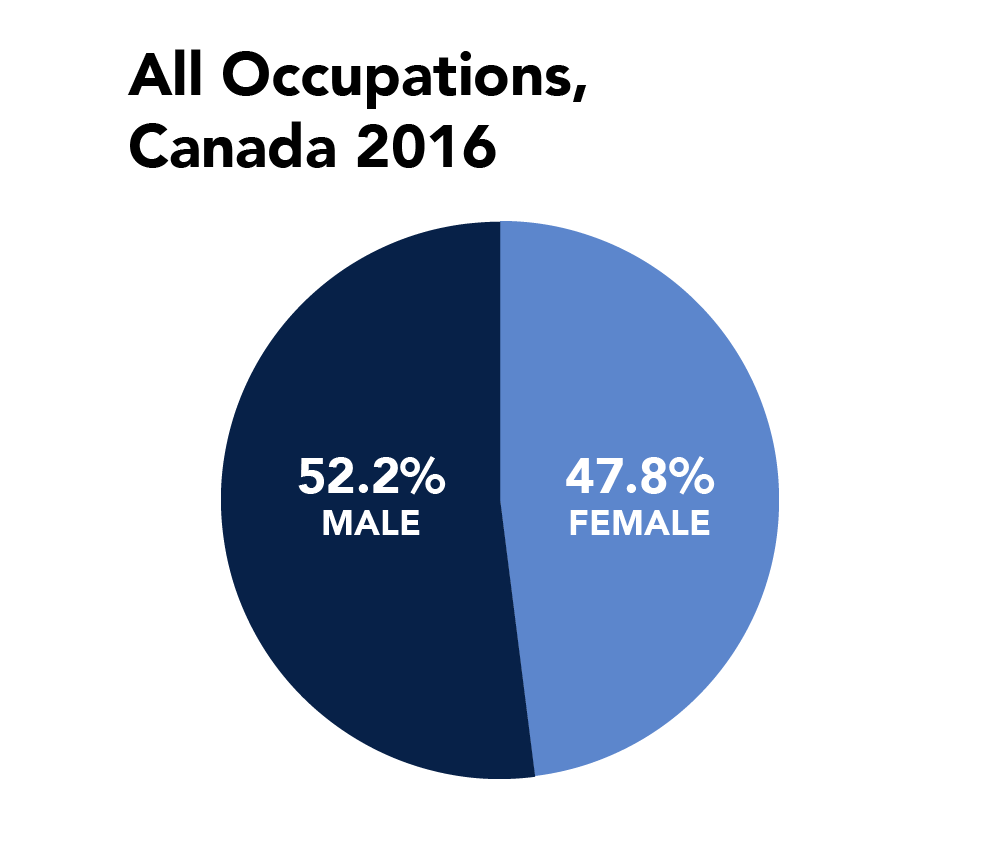
Female cultural workers made up 44.5% of the cultural workforce in Ottawa-Gatineau in 2016. This was somewhat less than the female share of the overall workforce in Ottawa-Gatineau, and also less than the national average for culture occupations. (note 1)

Average Employment Incomes
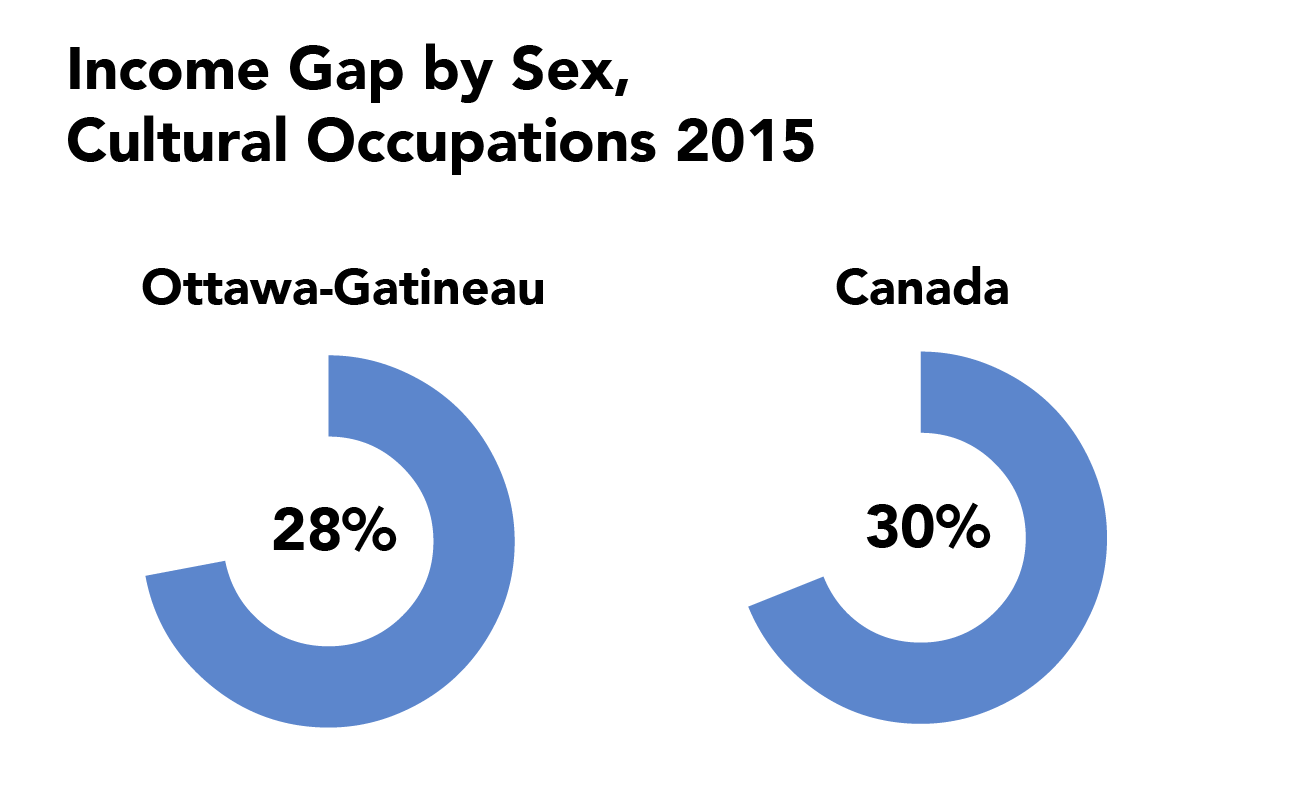
In 2015, there existed a significant gap in reported employment income between female and male cultural workers. The average annual employment income for female workers in culture occupations was over 28% lower than that for male cultural workers, a difference of nearly $20,000. This is somewhat lower than the national average of 30.4%, but it is a larger income gap than occurs across all occupations in Ottawa-Gatineau.
There are some important things to note about the income comparisons. First, it is difficult to have a precise list of culture occupations because some occupations are very broad and likely contain both culture and non-culture work. When occupations with large non-culture components are removed, the income gap is much smaller, though it is still over16%. (note 2) Second, the income gap varies considerably between occupations. (note 3)

Average employment income by sex, 2015, culture occupations
Ottawa-Gatineau: male $70,547.55; female $50,611.71
Canada: male $56,143.57 female $39,094.36
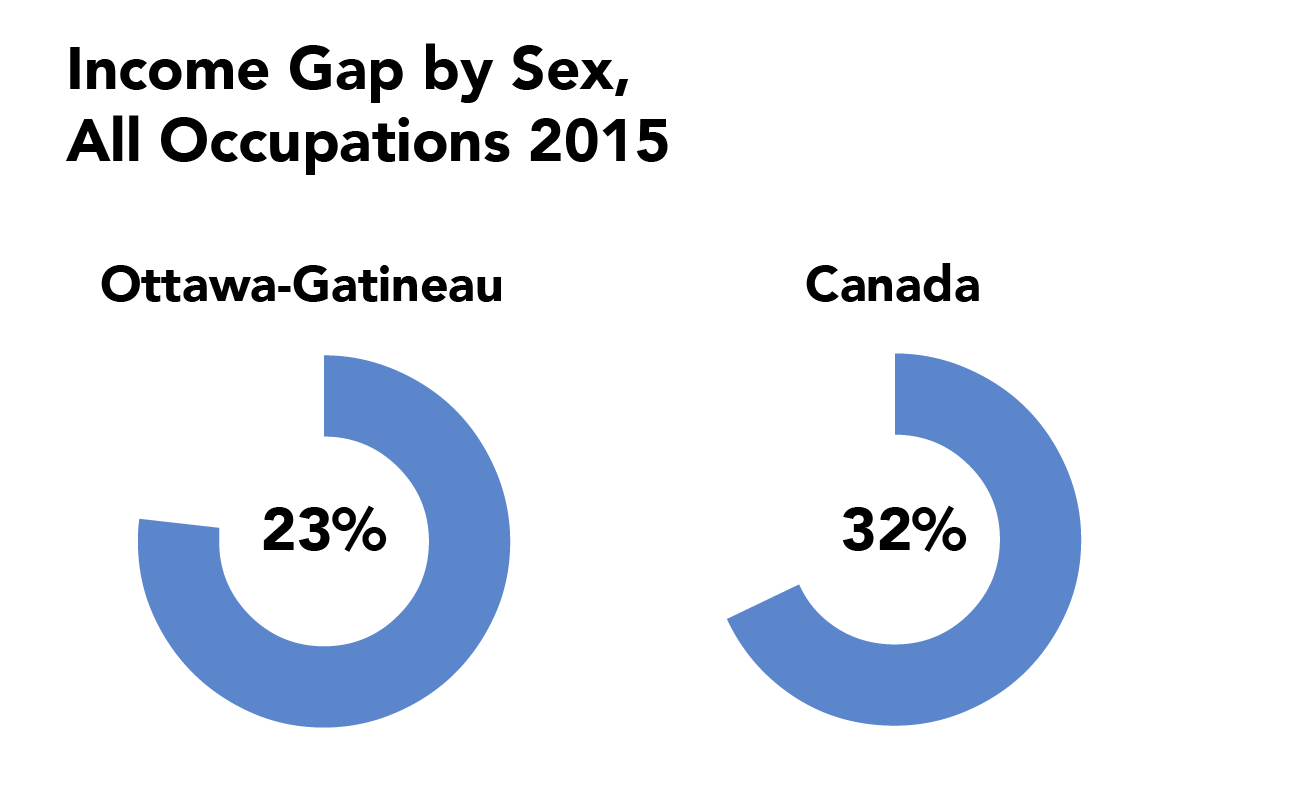
Average employment incomes by sex, 2015, all occupations
Ottawa-Gatineau: male $60,671; female $46,917
Canada: male $58,452; female 39,820
Income Gap by Occupation

Occupations with the largest gap in employment income, Ottawa-Gatineau, 2015
Support occupations in motion pictures, broadcasting, photography, and the performing arts - female workers earned 60% less
Actors and comedians - male workers earned 48% less
Other performers, not elsewhere classified - female workers earned 40% less
Painters, sculptors, and other visual artists - female workers earned 40% less
Artisans and craftspersons - female workers earned 39% less
Notes:
The population spotlight reports are based on the data collected by Statistics Canada as part of the 2016 Census. That survey only collected information on the basis of sex (male/female) as opposed to gender. Statistics Canada is aware of the significant limitations of the use of sex at birth instead of gender and, following a series of consultations in 2017 - 2018, will be collecting information on both sex at birth and gender identity in the 2021 census. For more information please see Statistics Canada.
For a list of culture occupations, including those that are sometimes excluded from our calculations because they likely contain both culture and non-culture work, see the OCRG website. Unfortunately, some culture occupations could not be included in this analysis due to data suppression. These occupations are film and video camera operators and patternmakers - textile, leather and fur products, which accounted for less than 1% of cultural workers in Ottawa-Gatineau. Although this is a small number, it is important to note that suppression and rounding of Census data may have resulted in small inaccuracies in the values reported in this report. For more information on Census rounding, see Statistics Canada.
The data used in this report are from the 2016 Census. However, the Census reports incomes from the previous year.